Today I had some free time, so I played around with the OpenStreetMap API. It turns out it’s quite easy to draw 3D-looking buildings on a canvas. After an hour or two of coding, I was able to render actual buildings from the OSM database:
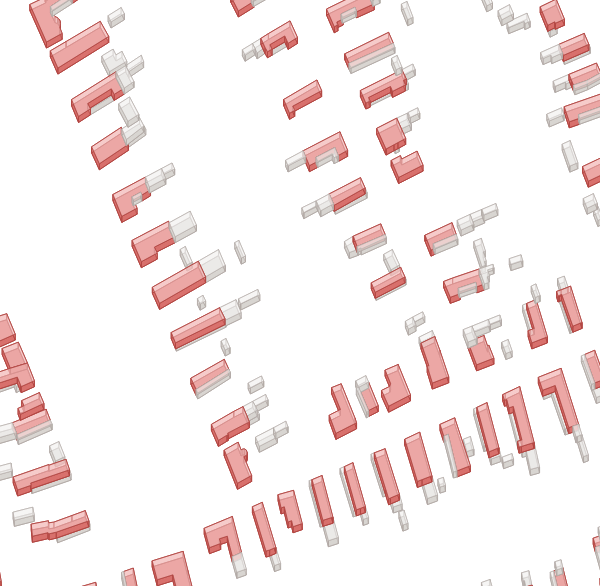 Buildings rendered on a canvas
On the above picture, red buildings are “primary” ones (i.e. ones with an address or a house number), while the grey ones are “secondary”. A demo version of the canvas map can be seen here (but only by people with decent browsers).
As a comparison, here’s how Mapnik renders the same data:
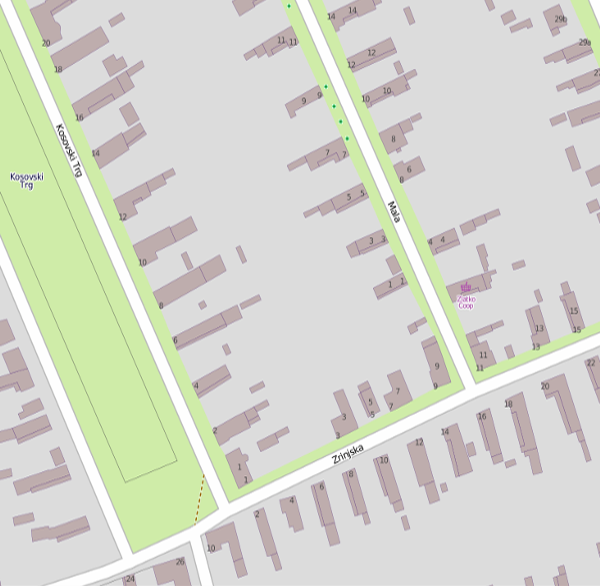 Same map rendered by Mapnik
Even nicer is the result when it is drawn over Mapnik’s tiles:
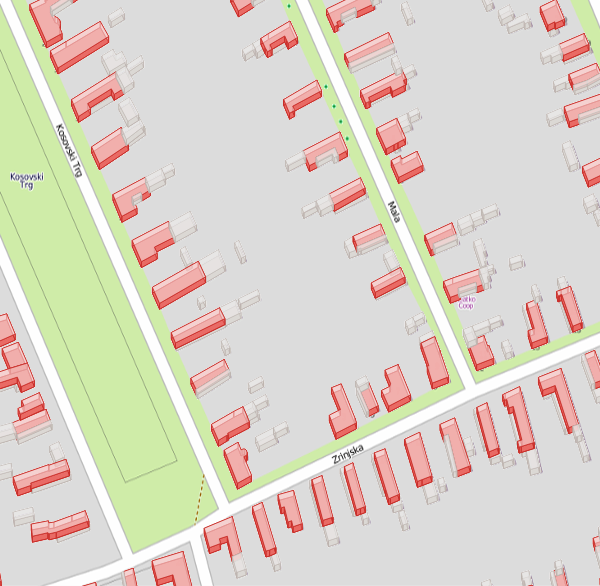 The two images merged together
The above result could be improved by not rendering any of the buildings by Mapnik, only the ground, & the roads. Then the canvas renderer could just place everything else on top of the Mapnik layer (including amenities and other interactive elements).
While maps rendered on the server side are more compatible with old browsers, canvas-based maps can be made more interactive (e.g. hovering or clicking on a building could highlight it and pop up a message with the complete address or relevant information). Other projects, such as Cartagen, are capable of rendering a high variety of objects, not just buildings, but they still require a lot of improvements, for example the display of road names is note very optimal.
Hopefully, as more browsers support HTML5 and canvas by the day, people will implement great interactive applications using this technology.